Dwayne Herzberg.
Atmosphere
tool for visualizing and validating meteorological and chemical data from the Pic du Midide Bigorre environmental measurement station.

Introduction
OMP, also known as Observatoire Midi-Pyrénées, is a public research establishment specializing in the sciences of the universe, the planet and the environment in the Midi-Pyrénées. The OMP comprises 6 laboratories with expertise in physics, astrophysics, chemistry, ecology-environment, earth, ocean and atmospheric sciences.
Within OMP, the Pic du Midi de Bigorre station is one of our most emblematic sites. Since its construction in 1878 at an altitude of over 2800 meters in the Hautes-Pyrénées. Thanks to its many instruments, the station provides laboratories with all the data they need to study the atmosphere and space. The Pic du Midi de Bigorre station has contributed to numerous scientific advances, notably in the fields of meteorology, climatology and solar physics.
The Pic du Midi de Bigorre station is equipped with a real-time data acquisition system. The data and operating parameters of the various instruments are recorded in a standardized format and stored on dedicated servers. The data is then used for scientific studies. These include understanding atmospheric phenomena and forecasting weather conditions.
Project objectives
In the world of scientific research, accurate, reliable data are essential. Data validation is a crucial step in ensuring accuracy and avoiding errors. Meteorology and the study of chemical substances are fields where data accuracy is of particular importance. Reliable data are essential for understanding and predicting climate patterns, as well as for assessing the consequences of chemical substances and their impact on the environment. However, data analysis is a complex and time-consuming task. Computer science and programming can provide solutions and tools to assist researchers in their work.
This project is the result of a request from Mr. Gilles Athier, engineer at the Midi-Pyrénées Observatory's Aerology Laboratory. Its aim is to develop a tool for visualizing and validating meteorological and chemical data from the Pic du Midi de Bigorre environmental measurement station. The data manipulated by this application are obtained from an ozone analyzer and a carbon monoxide analyzer, two instruments designed to collect data on the respective gases. The tool to be developed must enable easy invalidation of data according to various operating parameters. It must also offer data analysis-related functionalities, such as a smoothing function using a deburring filter. Finally, it will be essential for the tool to enable the user to export newly validated data in a specific format, to facilitate subsequent scientific studies based on them.
Data analysis
The data provided in this project are compressed files in zip format. Each of these files contains all the data emitted by the TEI48 and TEI49 instruments for a specific day. The files contained in the compressed file are text files named according to a specific rule: "{instrument}_{data type}". The files associated with the TEI48 instrument relate to the measurement of carbon monoxide concentration. The files associated with instrument TEI49 are linked to ozone concentration measurement. Each file corresponds to a specific type of data, such as main data ("Data") or operating parameters ("Fonct").
TEI48 instrument
The TEI48 instrument provides data on carbon monoxide concentration. Similar to the TEI49 instrument, it records various operating and calibration parameters that help to better understand and analyze the measurements made by the instrument.
Among the operating parameters is a status code called "flag", which provides information on each measurement performed. The "ratio" variable represents the signal-to-noise ratio, while "agci" corresponds to an AGCI (Analog Gain Control Interface) value used in the instrument. The internal temperature is recorded under the "intT" variable.
As far as flow rates are concerned, the "flow" variable indicates the flow rate of the instrument channel. The background signal in the instrument is recorded as "bkg". The calibration coefficient of the instrument is recorded under the variable "coef". The voltage measurement is saved as "biasvoltage". The "DateZero" and "DateMaz" variables indicate the instrument's calibration and maintenance dates respectively. Minimum and maximum voltage values are recorded under the "vMin" and "vMax" variables. The "oldBkg" and "newBkg" variables contain information on the previous and current background signal.
Some of the instrument's operating parameters can be filtered according to specific minimum and maximum thresholds. The variables that can be filtered with a minimum and maximum value are: "ratio" with a minimum signal-to-noise ratio of 1.1 and a maximum of 1.2, "agci" with a minimum intensity of 190000 and a maximum of 210000, "flow" with a minimum flow rate of 1.0 (with no maximum limit), and "biasVoltage" with a minimum supply voltage of -110 and a maximum of -120.
Calibration data supplied by the instrument include mean data ("Avg") and standard deviation ("Sd"). These calibration data are subject to maximum limits.
TEI49 instrument
The TEI49 instrument provides data related to Pressure and Ozone concentrations. In addition to these main data, it also records various operating data. This operating data includes a status code called "Flag", which indicates certain characteristics of each measurement.
In addition, the TEI49 records the flow rates of the two channels, "flowA" and "flowB", which represent the flow rates of channels A and B of the instrument respectively. The background signal in the instrument is recorded as "bkg". The calibration coefficient of the instrument is recorded under the variable "Coef".
Among TEI49's operating data, we also find temperature information, such as instrument bench temperature ("benchT"), ozone lamp temperature ("O3lampT") and internal temperature ("intT"). In addition, we have the "lampSetting" variable, which indicates the setting of the ozone lamp. Finally, cell frequencies are recorded under the "cellAint" and "cellBint" variables.
It should be noted that only some of these data can be filtered according to a minimum threshold. The filterable variables are "flowA" and "flowB" with a minimum threshold of 1.0, "cellAInt" and "cellBInt" with a threshold of 80000.
Needs analysis
The main aim of this application is to provide a functional, user-friendly tool for analyzing, verifying and manipulating the data collected, guaranteeing its accuracy and reliability for the scientific studies carried out within the Aerology Laboratory.
Data management
Data import is an essential feature of the application. The aim is to implement a method for accessing and importing data from a local directory. However, a future enhancement could be envisaged to facilitate direct data retrieval from the laboratory's servers. The import process is based on compressed files in zip format, which contain all the measurements emitted by the TEI48 and TEI49 instruments over the course of a day.
Once the compressed file has been loaded, the application must extract all available information and store it in a suitable structure. This step is crucial to make the data available for analysis. Gas measurements and operating parameter readings will be extracted and organized appropriately, to facilitate their processing and visualization within the application.
To better understand the structure of the data to be imported, we recommend you refer to the Data Analysis section of the report, where details on data composition are explained in depth.
Once the data has been processed and analyzed, the tool will allow you to export the data. The data export process consists of generating a text file containing gas contents averaged over a 5-minute time interval, taking into account only valid data in accordance with the rules defined by the operating parameters.
This data export process ensures that only valid and relevant data are included in the final file, enabling researchers to carry out subsequent analyses based on accurate and reliable data.
Data visualization
One of the fundamental objectives of the tool is to enable users to quickly visualize data in order to assess the need to intervene. To achieve this objective, the application must group instrument data together in a clear and organized way.
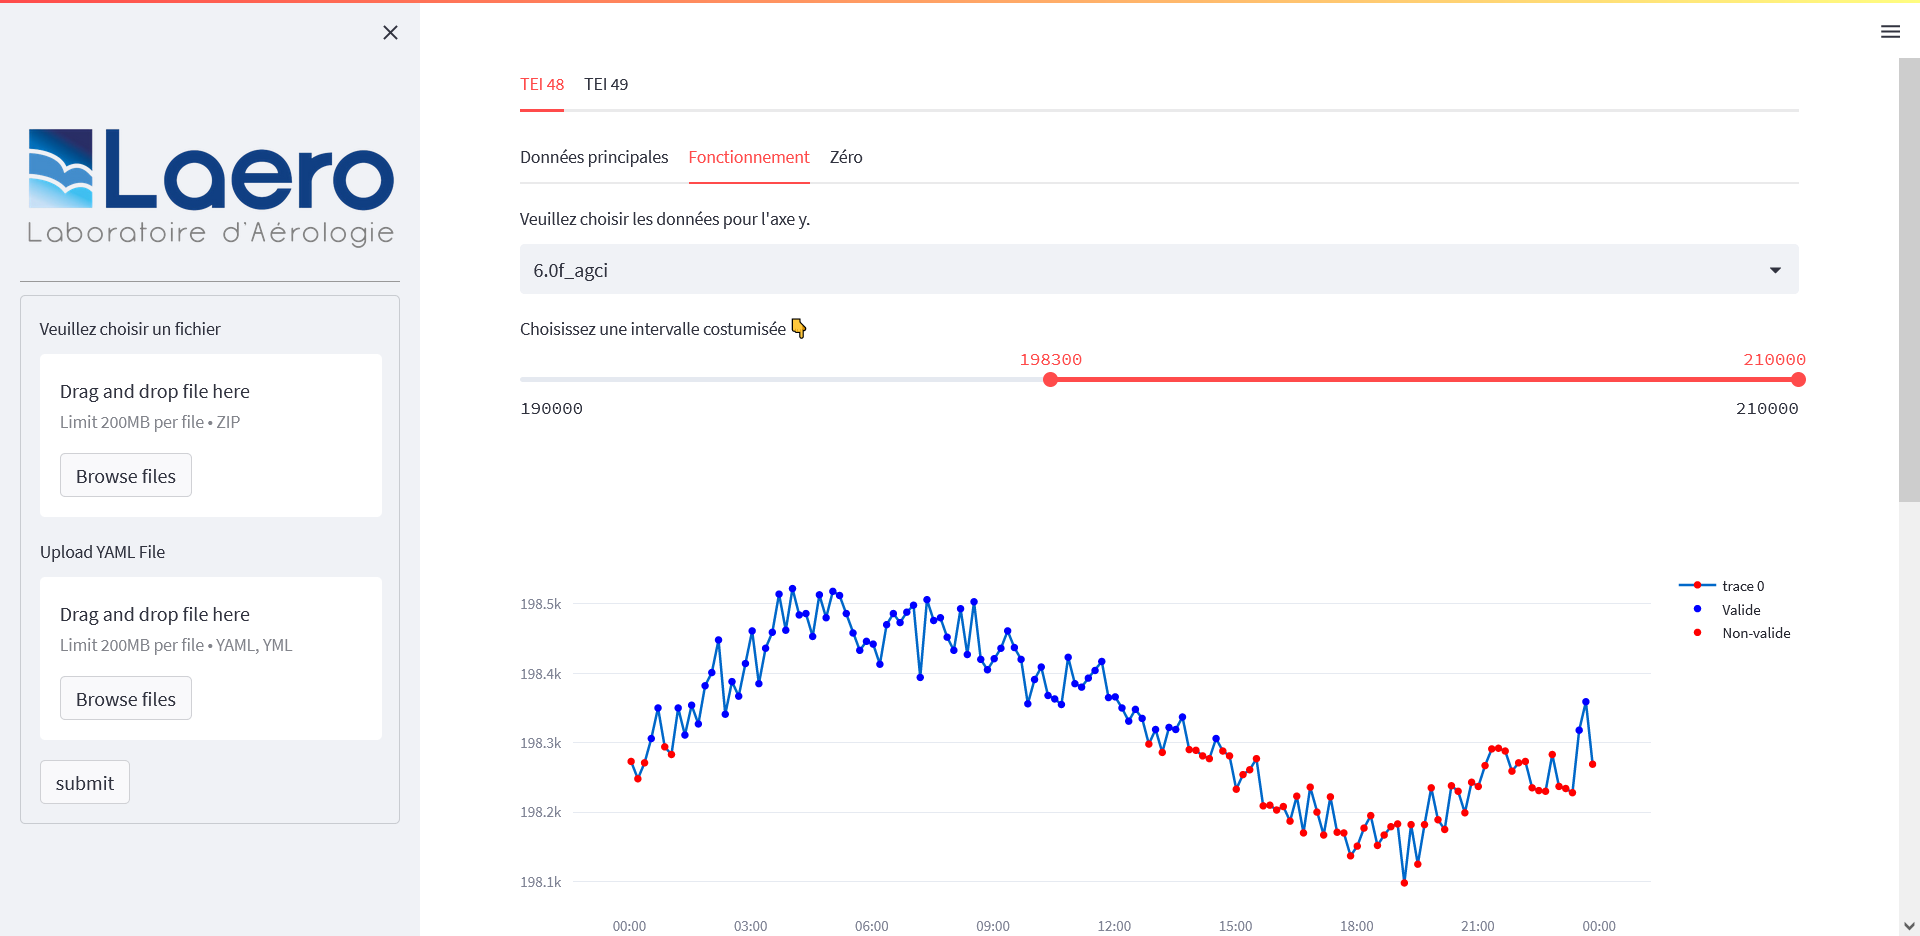
Each instrument will have its own dedicated tab. For example, one tab will be dedicated to data from the TEI48 instrument, while another tab will be dedicated to data from the TEI49 instrument. Each instrument will have several sub-tabs, one dedicated to gas contents, another for operating parameters and optionally a final one for calibration data. This tab-based organization facilitates navigation and enables users to concentrate on a specific part of the data.
Within each tab, an interactive graph will be available to represent the data selected by the user. The user can thus choose which data to display without having to navigate between several graphs. Below the graph, a table will summarize information relating to the data on the tab in question. This table displays the minimum, maximum, average and total number of records for each data item. This tabular presentation of statistics will enable researchers to quickly obtain an overview of trends and extremes in measurements.
This tabbed and sub-tabbed structure, combined with the presence of interactive graphs and summary tables, offers an intuitive approach to data exploration and analysis. Users will be able to navigate easily between the various sub-tabs to examine key data and operating parameters, view relevant graphs and obtain key statistical information.
Data processing
The tool will have to provide the user with the ability to invalidate data related to operating parameters that do not comply with defined minimum and maximum limits, as well as data corresponding to a selected time interval. This will enable researchers to filter out aberrant or undesirable data, thus guaranteeing the reliability of the results obtained.
To facilitate this functionality, the application will also offer the user the option of interactively modifying the limits of the operating parameters. This feature will enable thresholds to be customized according to the specific needs of each study, offering greater flexibility in data analysis.
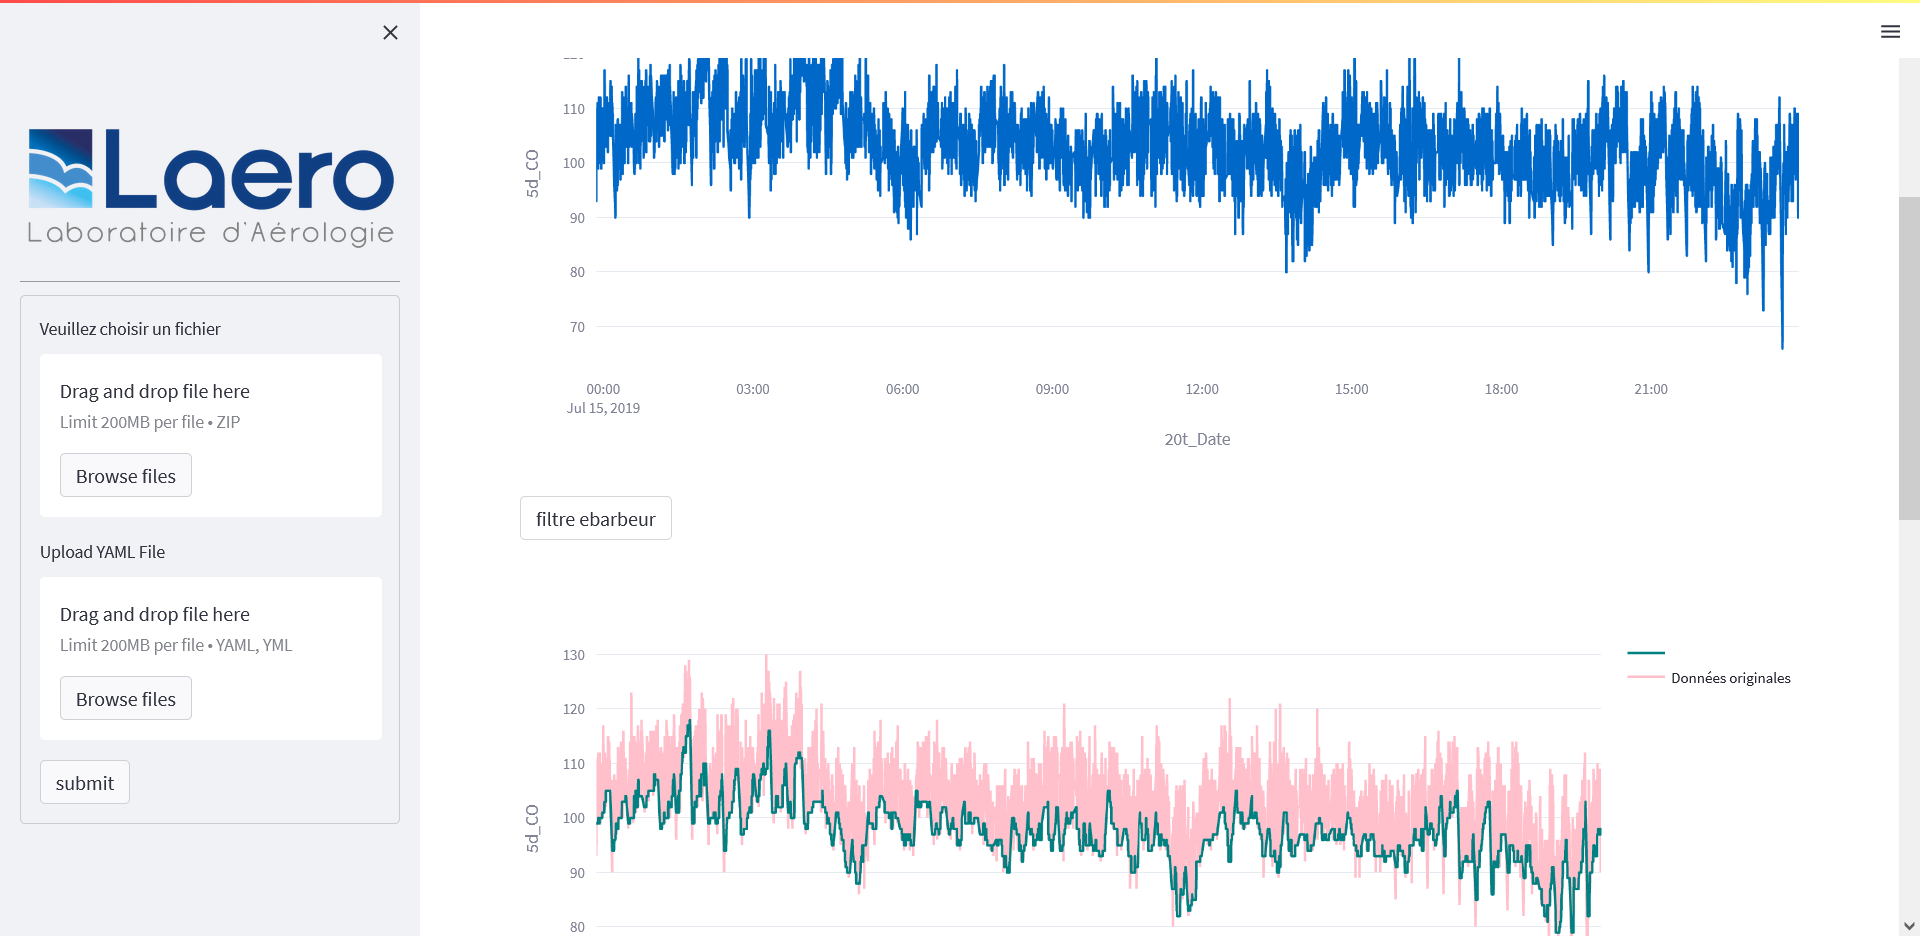
The user will be able to smooth some or all of the data using a trimming filter. This smoothing process will reduce unwanted fluctuations or noise in the data, enabling clearer visualization of trends and patterns.
To facilitate the management of filter parameters, all applied configurations will be saved in a YAML configuration file. This will enable the parameters used for a specific analysis to be saved and re-imported at a later date if necessary. In this way, researchers will be able to resume their work from a previous configuration without having to manually repeat all the filter configuration steps.
Product produced
We developed the tool in the form of a web application, this application was created using the Streamlit Framework. Framework specialized in data display and processing. The entire application was developed in Python, a versatile programming language widely used in the field of data analysis.
The application offers a user-friendly interface. Initially, the application displays a welcome page giving a few instructions on how to get started. It also offers the option of downloading a yaml configuration file template. The user can then import the compressed zip file and, optionally, the yaml operating parameters.
Once the data has been imported, the application organizes the data in separate tabs, with a main tab dedicated to each instrument (TEI48 and TEI49). Within each tab, data is divided into sub-tabs corresponding to the different types of data available, such as main data and operating parameters.
This tool offers advanced features for data analysis, such as the application of a deburring filter. Each sub-tab presents an interactive graph that clearly and succinctly represents the measurements.
The application allows the user to filter data according to specific criteria. This highlights measurements that do or do not comply with predefined limits, facilitating data evaluation.